 Complex
problems often cannot simply be answered with computer models. Experts
form their views on a topic from the totality of their expertise – which
includes knowledge of observational findings and model results, as well
as their understanding of the methodological strengths and weaknesses
of the various studies. Such expertise results from years of study of a
topic, through ones own research, through following the scientific
literature and through the ongoing critical discussion process with
colleagues at conferences.
Complex
problems often cannot simply be answered with computer models. Experts
form their views on a topic from the totality of their expertise – which
includes knowledge of observational findings and model results, as well
as their understanding of the methodological strengths and weaknesses
of the various studies. Such expertise results from years of study of a
topic, through ones own research, through following the scientific
literature and through the ongoing critical discussion process with
colleagues at conferences.For many topics it would be interesting for the public to know what the expert community thinks. If I had a dangerous disease, I would give a lot to learn what the best specialists from around the world think about it. Mostly, however, this expertise is not transparent to outsiders. The media only offer a rather selective window into experts’ minds.
More transparency can be achieved through systematic surveys of experts. The International Council of Scientific Academies (InterAcademy Council, IAC) in its review of IPCC procedures recommended in 2010: “Where practical, formal expert elicitation procedures should be used to obtain subjective probabilities for key results”. We took this advice and last November conducted a broad expert survey on future sea-level rise, in the context of a research project funded by NOAA. Lead author is Ben Horton (Rutgers University), the further authors are Simon Engelhart (University of Rhode Island) and Andrew Kemp (Tufts University).
The credibility of such surveys stands and falls with the selection of experts (see Gavin’s article A new survey of scientists). It is important to identify relevant experts using objective criteria. For us, formal criteria such as professorships were not relevant; our objective was to reach active sea-level researchers. To this end we used the scientific publication database Web of Science of Thomson Reuters and let it generate a list of the 500 researchers who had published the most papers for the search term “sea level” in the last five years in the peer-reviewed literature. It was found that at least 6 publications were required for a scientist to make it onto this list. For 360 of those experts we were able to find email addresses. We asked those for their estimates of the sea-level rise from 2000 to 2100 and 2300, both the “likely” rise (17th to 83rd percentile) and the range of the 5th to the 95th percentile (the 95th percentile is the increase which with 95 % probability will not be exceeded, according to the expert). 90 experts from 18 countries provided their responses.
Sea-level: a bit of context
For context, the following figure from the current IPCC report summarizes the sea-level evolution:
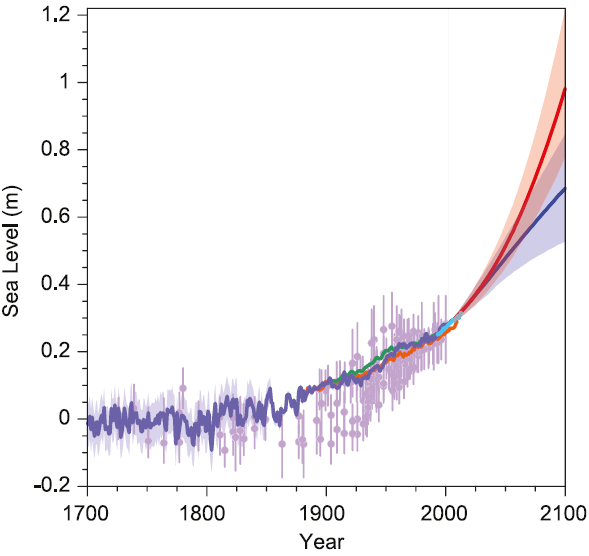
Figure 1: Sea level rise according to the IPCC report of 2013. Shown is the past history of sea level since the year 1700 from proxy data (sediments, purple) and multiple records from tide gauge measurements. Light blue are the satellite data (from 1993). The two future scenarios mentioned in the text (RCP8.5 and RCP2.6) are shown in red and blue, with their “likely” uncertainty range according to the IPCC (meaning a 66 % probability to remain inside this range). Source: IPCC AR5 Fig. 13.27.
A more detailed discussion of the IPCC sea level numbers can be found here. The red and blue future scenarios correspond (to good approximation) to the two climate scenarios on which we surveyed the experts: blue a scenario with effective climate mitigation, red a scenario with a further unabated growth of emissions into the 22nd Century.
The survey results
The following graph shows what the surveyed experts expect for these two scenarios up to the year 2100:
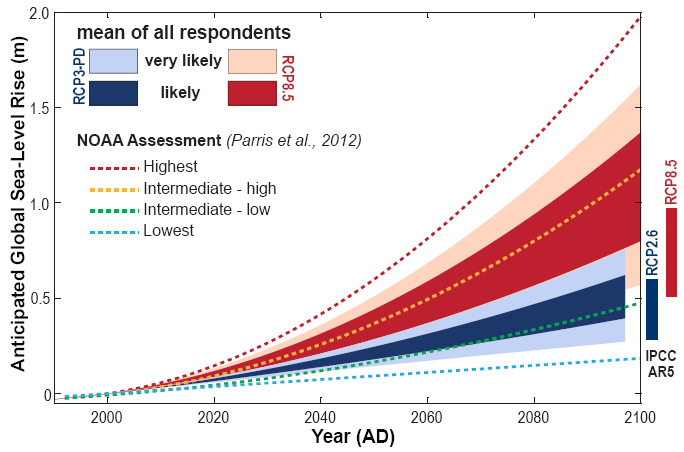
Figure 2: Sea level rise over the period 2000-2100 for two warming scenarios (red RCP8.5, blue RCP3). The ranges show the average numbers given across all the experts. The inner (darker) range shows the 17 to 83 percentile values, the outer range the 5 to 95th percentiles. For comparison we see the NOAA projections of December 2012 (dashed lines) and the new IPCC projections (bars on the right). Since this graph shows the increase from the year 2000, about 25 cm should be added for a direct numerical comparison with the previous graph.
The experts gave a median rise of 40-60 cm for the blue climate scenario and 70-120 cm for the red scenario. Most of the experts thus expect a higher rise than the IPCC – about two-thirds (65%) give the upper limit for the red ‘likely’ range a higher value than the IPCC, even though the IPCC has increased its projections by ~60% since its last report of 2007. In expert circles the IPCC reports are widely considered to be conservative; this is empirical confirmation.
The following table shows all the median values:
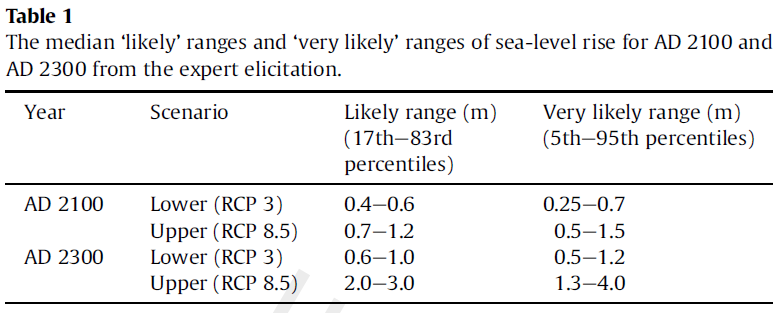
Highly relevant for coastal protection is a “high-end” value that with high probability will not be exceeded – let’s say the 95th percentile in the table above, below which the rise will remain with 95 percent probability. For the red scenario, about half of the experts (51%) gave 1.5 meters or higher for this, a quarter (27%) even 2 meters or higher. This is for the increase from 2000 to 2100. In the longer term, for the increase from 2000 to the year 2300, the majority of experts (58%) give this high-end value as 4 meters or higher.
These numbers reflect the fact that experts (including myself) have become more pessimistic about sea-level rise in recent years, in the light of new data and insights mainly concerning the dynamic response of the ice sheets.
Two camps?
Experts quoted in the media are often chosen according to media needs – quite popular is the presentation of topics as a controversy with one expert pro and one against. In this way the experts are portrayed as divided into “two camps”, regardless of whether this reflects the reality. This “two-camps theory” is then used as a justification to cite (in the name of supposed balance) counter-arguments by “climate skeptics” with doubtful expertise. Especially in the US this “false balance” phenomenon is widespread.
In the distribution of expert estimates we find no evidence in support of the two-camps theory, as shown in the following graph.
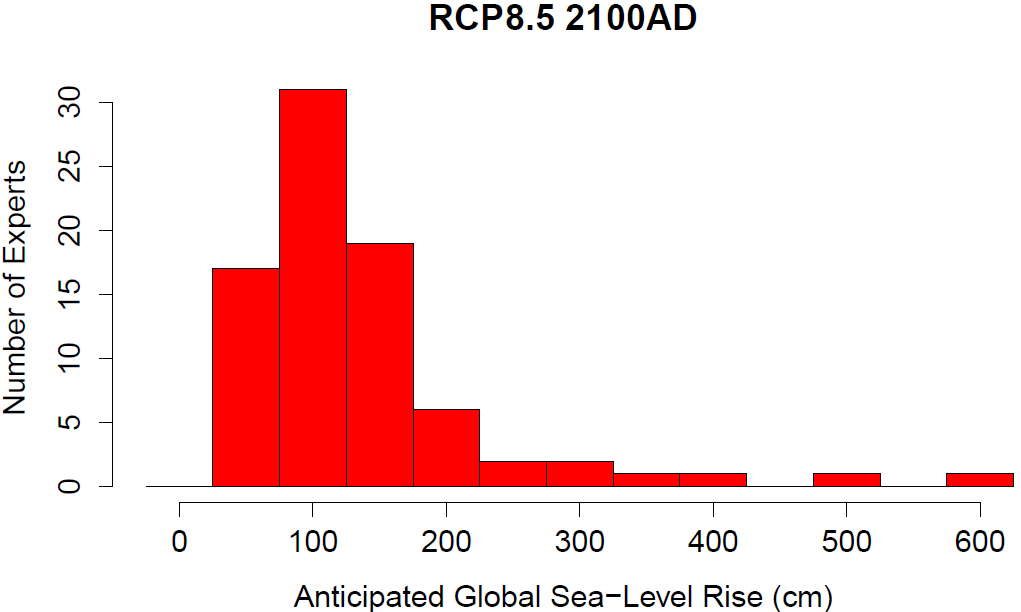
Figure 3. Distribution of the experts’ answers to the upper limit of the ‘likely’ range for the RCP8.5 scenario by the year 2100. (These numbers can be compared to the value of 98 cm given in the IPCC report.)
There is no split into two groups that could be termed “alarmists” and “skeptics” – this idea can thus be regarded as empirically falsified. That is consistent with other surveys, such as that of continental ice experts by Bamber & Aspinell (Nature Climate Change 2013). Instead, we see in the distribution of responses a broad scientific “mainstream” with a normal spread (the large hump of three bars centered on 100 cm, in which I also find myself), complemented with a long tail of about a dozen “pessimists” who are worried about a much larger sea-level rise. Let’s hope these outliers are wrong. At least I don’t see a plausible physical mechanism for such a rapid rise.
Weblinks
PIK sea level pages
A study on the regional differences in sea-level rise: A scaling approach to project regional sea level rise and its uncertainties
A study on impacts on cities: Future flood losses in major coastal cities
Reference
Horton, B.P., et al., Expert assessment of sea-level rise by AD 2100 and AD 2300, Quaternary Science Reviews (2013), http://dx.doi.org/10.1016/j.quascirev.2013.11.002
Source/Fonte: realclimate
Nenhum comentário:
Postar um comentário